Physical and Public Health Strategy 2025 - 2028
About us
Cumbria, Northumberland, Tyne and Wear NHS Foundation Trust is one of the largest mental health and disability trusts in England. We provide mental health, learning disability and neurological care for people across the north of England as well as some national specialist services. The Trust works from more than 70 sites across Cumbria, Northumberland, Newcastle, North Tyneside, Gateshead, South Tyneside and Sunderland. We also run several regional and national specialist services. Along with partners, we deliver support to people in their own homes, and from community and hospital-based premises. We have around 9,000 people working for us and a budget of over £500 million, serving a population of around 1.7 million people.
NTW Solutions is a wholly owned subsidiary company of the Trust, providing a range of services to support better care. This includes estates, facilities, clinical and business support services. Throughout this document, references to ‘CNTW’ refers to the CNTW Group, incorporating both the Trust and NTW Solutions.
CNTW is part of the North East North Cumbria Integrated Care System (NENC ICS). The ICS is formed by NHS organisations and upper-tier local councils in the North East North Cumbria area and includes the voluntary sector, social care providers and other partners with a role in improving local health and wellbeing. By working together to develop shared plans and joined-up services we aim to improve outcomes in population health and healthcare, tackle inequalities in outcomes, experience and access, enhance productivity and value for money, and help the NHS support broader social and economic development. CNTW is one of eleven Trusts in the NENC ICS, working together as a Provider Collaborative on sustainability.
Introduction
CNTW is committed to delivering low carbon, sustainable healthcare. We recognise the relationship between our impact on the environment and the impact of climate change on public health and the services we provide. In 2020 the Trust joined a growing number of NHS organisations who responded by declaring a Climate and Ecological Emergency and acknowledge that “climate change is the defining issue of our time, and we are at a defining moment… without drastic action today, adapting to these impacts in the future will be more difficult and costly.”
This commitment is reflected in CNTW’s Strategic Ambition 4, to “be a sustainable, high performing organisation, use our resources well and be digitally enabled. We will be accountable for the money we spend; we will live within our means, and we will work in a way that is kind to the planet.” Similarly, NTW Solutions includes ‘Tackling the Climate Emergency’ as one of its five strategic aims within the NTW Solutions strategy, focussing on reducing our carbon emissions, minimising waste and efficiency, raising staff awareness and making the most of our green spaces.
We support the national NHS ambition to reach net zero carbon emissions, delivering efficiencies and value while reducing our contribution to climate change, as set out in the ‘Delivering a Net Zero National Health Service’ report. This Green Plan is a Board approved strategy for sustainable development at CNTW over the next three years and updates our existing Green Plan 2021-26 to align with Greener NHS guidance.
Our Vision
Simply put, we believe sustainable healthcare means better healthcare.
Our aim is for sustainability to be a fully integrated, core value in our organisational decision making, shaping how we evolve our healthcare services to support the communities we serve to thrive.
As a mental health and disability provider, we support some of the most vulnerable people in society, and we are aware that the use of language such as “climate emergency”, “climate crisis” and “climate chaos” could cause anxiety or distress to those we serve. We will seek to mitigate this risk wherever possible. We believe that by focussing on hope and opportunity for change and recovery, together we can make a positive impact.
Our Carbon Emissions
‘Delivering a ‘Net Zero’ National Health Service’ sets out two clear goals for carbon reduction across the NHS. CNTW adopts these targets to contribute to the national ambition. These are to achieve:
- Net zero carbon by 2040 for the emissions we control directly. This is known as our Carbon Footprint. By 2028-2032 we will reduce our Carbon Footprint by 47%, compared to our emissions in 2019/20.
- Net zero carbon by 2045 for emissions we can influence. This is known as our Carbon Footprint Plus. By 2036-2039 we will reduce our Carbon Footprint Plus by 73%, compared to our emissions in 2019/20.
The emission sources that are included within our Carbon Footprint and our Carbon Footprint Plus are detailed below.
We collect activity data for these different emissions sources and calculate the associated carbon emissions using nationally published conversion factors, guided by best practice set out in the Greenhouse Gas Protocol. Emissions are reported in tonnes of carbon dioxide equivalent (tCO2e), a figure that summarises all Greenhouse Gas (GHG) emissions with varying global-warming potential (GWP) into a single equivalent amount of carbon dioxide with the same global warming potential.
The table below shows the breakdown of our annual Carbon Footprint since 2019/20. Energy use is associated with 88.4% of our emissions, with travel accounting for 10.5% and the remaining 1.1% from waste and water.
Overall, we have a good level of confidence in the data available and can demonstrate that our annual emissions have reduced by 1,699 tCO2e (14%) over the last five years.
There are gaps in the data currently collated for inhalers, fugitive refrigerant gases and some energy data in buildings we lease. We will continue to improve the quality of our emissions source data to provide the transparency and completeness of our carbon reporting, and as crucial feedback on the scale and urgency of action needed to be on track to meet our carbon targets.
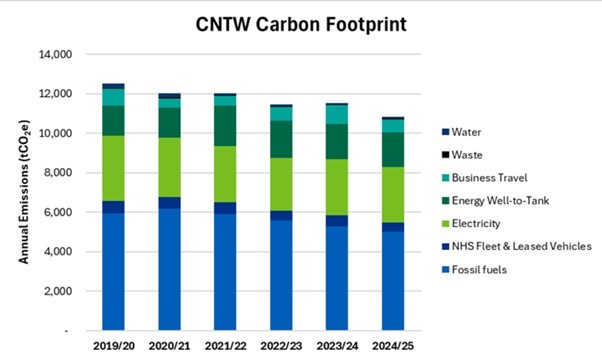
Breakdown of CNTW annual Carbon Footprint since 2019/20:
Annual Greenhouse Gas Emissions (tCO2e)
| Emissions Source | 2019/20 | 2020/21 | 2021/22 | 2022/23 | 2023/24 | 2024/25 |
|---|---|---|---|---|---|---|
| Fossil fuels | 5,925 | 6,179 | 5,896 | 5,574 | 5,276 | 4,997 |
| NHS Fleet & Leased Vehicles | 654 | 592 | 593 | 509 | 553 | 471 |
| Scope 1 Direct Sub-total | 6,579 | 6,771 | 6,489 | 6,083 | 5,829 | 5,468 |
| Electricity | 3,284 | 2,997 | 2,847 | 2,655 | 2,655 | 2,819 |
| Scope 2 Indirect Sub-total | 3,284 | 2,997 | 2,847 | 2,655 | 2,845 | 2,819 |
| Energy Well-to-Tank | 1,547 | 1,512 | 2,069 | 1,887 | 1,804 | 1,754 |
| Business Travel | 852 | 477 | 483 | 707 | 953 | 662 |
| Waste | 23 | 53 | 43 | 36 | 26 | 50 |
| Water | 238 | 207 | 75 | 80 | 76 | 70 |
| Scope 3 Indirect Sub-total | 2,660 | 2,250 | 2,670 | 2,710 | 2,859 | 2,536 |
| Carbon Footprint Total | 12,523 | 12,018 | 12,006 | 11,448 | 11,533 | 10,824 |
CNTW’s Carbon Footprint Plus is more difficult to measure but the indirect carbon emissions associated with NHS services are known to be significantly greater than the controllable emissions reported within the Carbon Footprint boundary.
We recently completed an assessment of our supply chain emissions, using carbon factors per £ spent on different procurement categories (see Figure 3). This initial assessment does not include emissions from staff commuting and patient and visitor travel data but still indicates that the emissions we influence are at least three times our controllable emissions (shown in Figure 4).
This highlights the importance of taking action to influence our supply chain now to enable progress towards the national Net Zero by 2045 ambition.
Breakdown of carbon emissions from CNTW supply chain:
2023/24 Carbon Emissions
| Procurement Category |
tCO2e |
% |
|---|---|---|
| Building & Engineering Products & Services | 7,616 | 21.7% |
| Purchased Healthcare | 6,943 | 19.8% |
| Office Equipment Telecomms Computers & Stationery | 5,795 | 16.5% |
| Hotel Services Equipment Materials & Services | 5,486 | 15.6% |
| Staff & Patient Consulting Services & Expenses | 4,395 | 12.5% |
| Pharmaceuticals Blood Products & Medical Gases | 1,685 | 4.8% |
| Fuel Light Power Water | 951 | 2.7% |
| Provisions | 815 | 2.3% |
| Transportation | 692 | 2.0% |
| Dressings | 434 | 1.2% |
| Recreational Equipment & Souvenirs | 102 | 0.3% |
| Medical & Surgical Equipment | 85 | 0.2% |
| Staff Clothing | 56 | 0.2% |
| Patients Appliances | 20 | 0.1% |
| Furniture Fittings | 17 | 0.0% |
| Gardening & Farming | 13 | 0.0% |
| Patients Clothing & Footwear | 11 | 0.0% |
| Hardware Crockery | 3 | 0.0% |
| Laboratory Equipment & Services | 1 | 0.0% |
| Bedding Linen & Textiles | 1 | 0.0% |
| Chemicals & Reagents | 1 | 0.0% |
| Diagnostic Imaging & Radiotherapy Equipment & Services | 0 | 0.0% |
| Procurement Total | 35,123 | 100% |